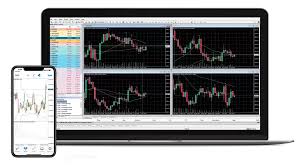
MetaTrader 4 Tutorial: Tips for Effective Charting
MetaTrader 4 remains one of the most widely used trading platforms in the world, thanks to its robust features and user-friendly interface. But when it comes to maximizing its potential, effective charting is the cornerstone of informed decision-making. Whether you’re a seasoned trader or just starting, mastering MT4 charting can significantly impact your ability to interpret the market and execute trades efficiently. This article dives into essential tips for effective charting on MetaTrader 4, designed to help you stay ahead of the curve.
Understanding the Basics of MT4 Charting
Before jumping into complex strategies, you must understand the basics of MT4 charting tools. The platform offers three main chart types—line, bar, and candlestick. While bar and candlestick charts provide in-depth insights into price movements, candlesticks are particularly preferred for their visual simplicity and comprehensive data representation.
To switch between these formats, simply right-click on your chart, go to Chart Type, and select your preference. Additionally, MT4 allows you to zoom in, zoom out, and toggle between timeframes ranging from one minute to one month, providing flexibility to analyze both short- and long-term trends.
Customize Your Charts for Better Clarity
Cluttered charts can hinder your ability to make quick decisions. Customize your charts to suit your trading style by adjusting colors, removing unnecessary gridlines, and changing the background for better visibility.
To do this, right-click on your chart, select Properties, and start making adjustments. For instance, you can highlight bullish candles in green and bearish candles in red for sharper differentiation. Personalizing your charts this way ensures you can read data effortlessly, even during high-pressure trading sessions.
Leverage Indicators and Drawing Tools
MT4 offers a rich set of built-in indicators and drawing tools to help analyze trends, momentum, and potential reversal points. Popular options include Moving Averages, Bollinger Bands, and the RSI (Relative Strength Index). You can add indicators through the platform’s Navigator tab and layer them on your chart for detailed analysis.
Additionally, drawing tools like trendlines and Fibonacci retracements offer further clarity, enabling you to mark critical support and resistance levels. Remember, however, to avoid overloading your chart with too many tools—it can lead to decision fatigue.
Utilize Templates to Save Time
Once you’ve created an ideal chart setup, save it as a template. This way, you can avoid repeating customizations every time you open a new chart. Simply right-click on the chart, select Template, and choose Save Template. You can easily apply this template to any future workspace for continuity and time efficiency.
Close the Gap Between Data and Decisions
Effective charting on MT4 is about creating systems that turn raw data into actionable insights quickly. By mastering its charting tools, customizing visuals, leveraging indicators, and saving templates, you’ll position yourself to make better-informed trading decisions.
Metatrader 4 offers the features, but success will depend on your discipline and ability to fine-tune your approach. Start applying these strategies today and take your trading to new heights!